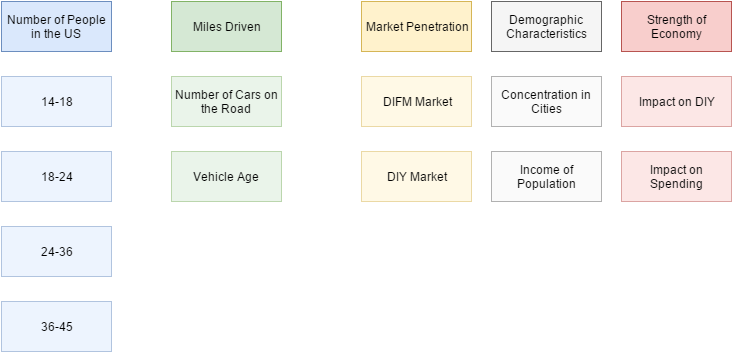
Think: people need to get around. Usage of cars (potentially) continues to increase in popularity (also need to think about transportation in cities versus rural areas and subsequently, growth in populations…potentially, income too).

Think: people need to get around. Usage of cars (potentially) continues to increase in popularity (also need to think about transportation in cities versus rural areas and subsequently, growth in populations…potentially, income too).

Key Points of Interest
In observing Advance’s ability to execute, I’m curious of the following:
Status Quo


Question (Brent Bracelin Pacific Crest Securities – Analyst): I just want to drill down there a little bit. What question can you answer that I can’t get Microsoft, PowerBI try to answer, you got to get a concrete example of that.
Response (Francois Ajenstat Tableau Software, Inc. – VP of Product Development): So, a good concrete example, let’s say you want to look at your year-over-year difference in sales, very simple question, what is the difference this year compared to last year? In Tableau, that’s a three second solution. Three clicks, you’re done. And PowerBuoy or even tools like Qlik, you’ll have the right code, you’ll write complex calculations that would get you there. Which means, in order to do that, very few people, only specialists can do it, where what we want to do is expand the opportunities for the number of people that can do that. It’s a very simple question, right. Even in a running sum. What’s our running sum of sales this quarter. Really simple question. Extremely hard to do in any other tool. Three clicks in Tableau.
The transition from DBaaS to SaaS to IaaS has been done out of necessity, analysts say. Amazon Web Services has grown into a $7 billion-plus annual revenue vendor focusing almost solely on IaaS. At its re:Invent conference, AWS Senior Vice President Andy Jassy practically mocked Oracle for its aggressive sales tactics and lock-in licensing. AWS is aiming directly at Oracle in its products too, releasing a database migration tool that will automatically replicate an Oracle or any other database into an AWS equivalent one. Aurora is AWS’s MySQL cloud database, which it says is now the fastest growing product in AWS history.
“From a purely competitive standpoint they need to halt customers from moving to a public cloud IaaS provider such as AWS, Azure and others,” wrote Gartner cloud analyst Sid Nag. “AWS (and others) are adding and continue to add new features, capabilities and toolsets for customers to migrate Oracle’s products, for example databases, on to AWS.” This summer Oracle’s profits slid 24%, thanks to cloud competitors. Oracle had to stem the tide.
Source: Does Oracle have a shot in the IaaS cloud market versus Amazon and Microsoft?
[pdf-embedder url=”/ppt/Equity/AAP/AAP%20-%20Preliminary%20Investment%20Considerations%20(07.31.16).pdf”]
Overview
Other Notes
Company stats
Competition
Derived from Piotroski screen
Observations
Analyze
Observations
Considerations
Analyze
Reference Material