Schematic, pre-visualization

Schematic, pre-visualization

Software companies are generally valued for their high growth while profitability measures are often overlooked. Twilio, a recent software IPO, is currently trading at 17x it’s next twelve months estimated revenue. In an effort to “ground” software valuations, I backsolved fundamental indicators which enable us to observe a company’s fall from the sky towards a valuation closer rooted to traditional fundamentals.
The model works as follows:
[iframe src= “http://kfguiang.co/xls/Software/Theorems/RequiredIRR.htm” width=”100%” height=”400″]
Here, we observe Twilio’s financial profile. We analyze its current growth rate, and its current cost structure. There are two possible drivers of returns:
As we see here, companies with a higher rate of growth typically have lower margins
[iframe src= “http://kfguiang.co/d3/scatter/index.html” width=”100%” height=”420″]
Furthermore, our analysis reveals that at below $1.0bn in annual revenue, growth is typically expected in the range of 15 – 20%
[iframe src= “http://kfguiang.co/d3/growth/index.html” width=”100%” height=”420″]
At this point, we can start rationalizing our target’s growth rate: for how long can it sustain its current growth? Once we determine this, we can observe how aggressively our target is currently investing in growth:
[iframe src= “http://kfguiang.co/d3/barchart/index.html” width=”100%” height=”420″]
We can further refine our analysis by observing cost structures across all companies within the software universe to ground expectations in where costs can be optimized or whether certain cost structures are sustainable:
[iframe src= “http://kfguiang.co/d3/boxplot/index.html” width=”100%” height=”420″]
Here, we can “sanity check” where we believe growth will come from. The following table sensitizes margin achieved versus implied revenue:
[iframe src= “http://kfguiang.co/xls/Software/Theorems/GrowthImplied.htm” width=”100%” height=”420″]
People
Corporations
Growth
Inflation
Macroeconomic Model for Growth
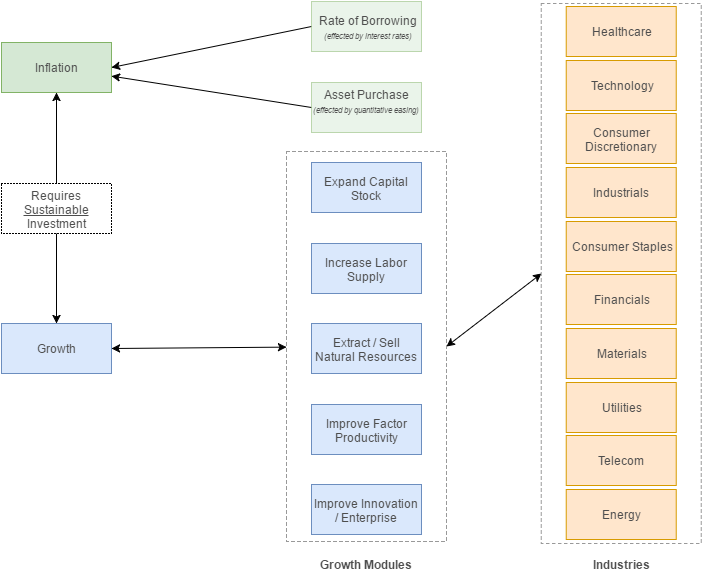
Simple Diagram which outlines the relationship between growth and inflation.

Risk Return Profiles for Various Asset Classes
Once we develop an understanding for trends in macroeconomic environments, we can begin to select which asset classes to diversify in to. In general, investors should be compensated marginal returns for marginal risk assumed.
[pdf-embedder url=”/xls/Theorems/Risk%20Return%20Profiles.pdf”]
Assessing Risk
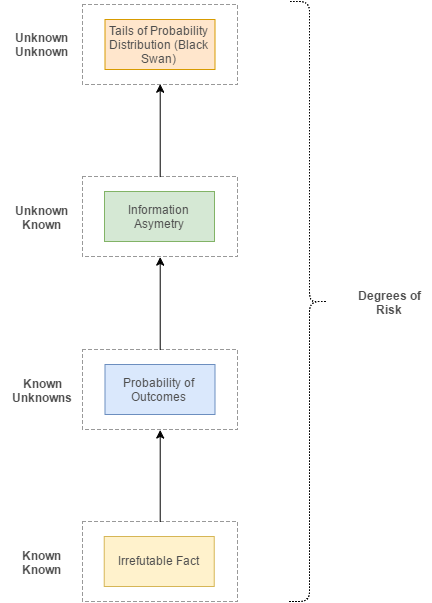
Risk compensation is determined by our degrees of understanding with an important emphasis on truth versus belief. The more we cannot assess, the higher degree of risk we take on (and theoretically, higher degrees of return). As such, contemplate the returns of the following asset classes:

Assessing Market Opportunity

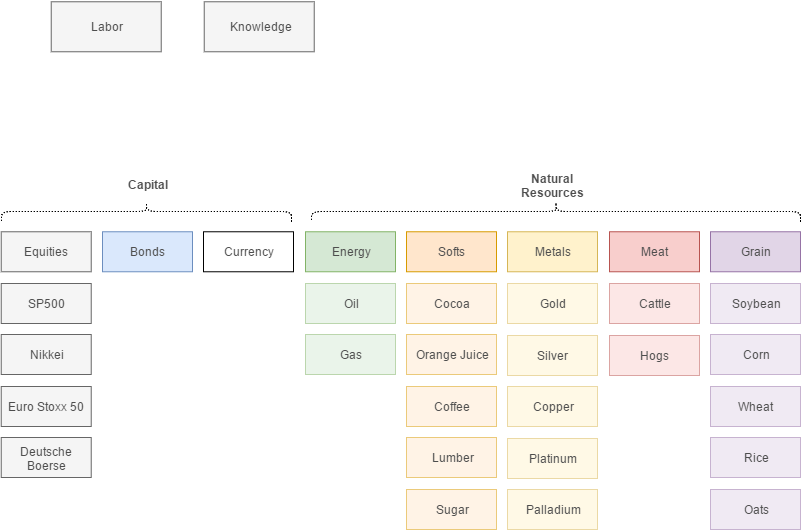
Resource Market

Theoretical P&L for restaurant startup. Buildup on left, income sensitization on right. FIgures in blue box represent considerations to model in the future.
Primary model will include breakeven analysis resulting from 1. initial investment (furniture, equipment, licenses); 2. cash flow over time 3. potential liquidation opportunities (sale) in order to arrive at theoretical IRR.
My assertion was that IRR for a restaurant should exceed 25% (roughly equivalent to that of a venture capital investment) given the high degree of effort required to operate the business.
[pdf-embedder url=”/xls/Restaurant/Restaurant%20Model.pdf”]
Secular Shifts
per Credit Suisse
Capital Deployment
Corporate Life Cycle
Deployment Considerations
per Credit Suisse
To demonstrate “fair” values for equity issues, I’ll elaborate on techniques in credit analysis to identify illustrate the relationships between bond yields and equity yields.
Components
Financial Risk Profile Assessment
(per Standard and Poor’s)

Default Probability
(per HomeProtect.uk)

Change in Sales
Change in Cost
Value Drivers
Per Credit Suisse
Per Wikipedia
Finding companies with strong earnings growth at depressed prices: